It is generally a truism that everyone operating a SOC for any length of time finds themselves looking to improve SOC efficiency, but it is also a truism that you can only improve what you measure. The first step in this process is establishing the right SOC metrics. As expected most enterprises don’t do this from day one, but as the organization and SOC mature, the resulting maturity leads to an effort to establish a measurement process that will give a clear picture of how the SOC is performing in both general and in specific areas over time. Once SOC metrics are selected and a measurement process is put into place it becomes much easier to understand which actions will create meaningful improvements. Reporting then also becomes much more transparent and can be communicated clearly to team members and executive management.
SOC Metrics for Improving Efficiency
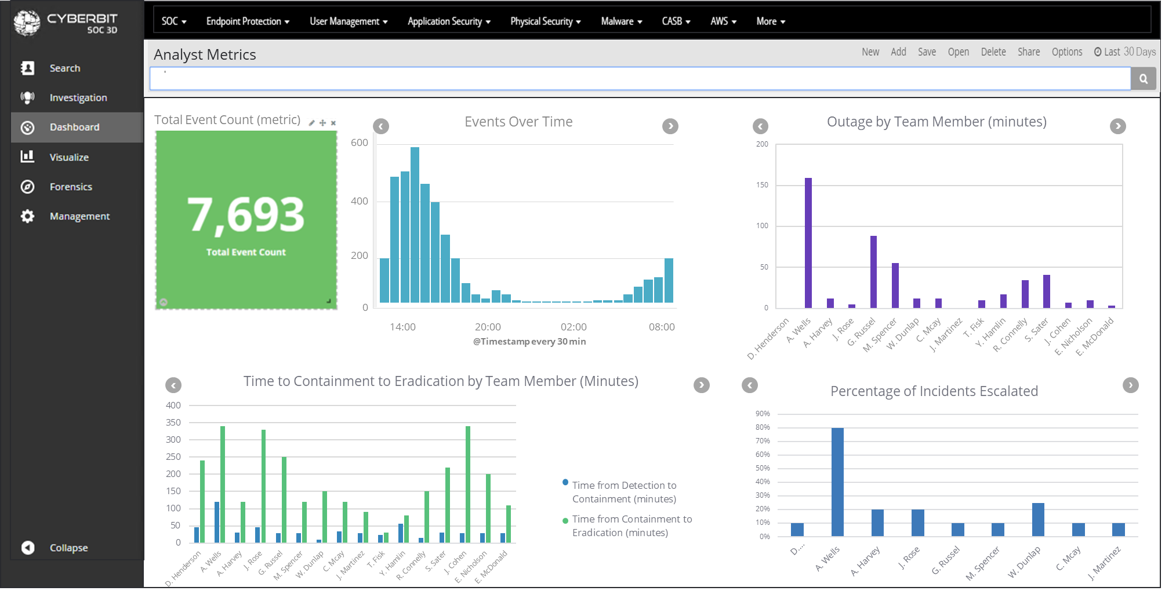
Analyst Efficiency Metrics – These metrics are aimed at measuring and tracking the individual performance of SOC team members. These SOC metrics help managers identify outstanding analysts, acknowledge their contribution, and learn from them. They can also assist in identifying specific skill gaps that affect either a specific individual or relate to the entire team. Once a skill gap has been clearly identified it can be targeted for instruction, training and support to ensure it is improved. Tracking this over time can show the relative improvement as well as ensuring outliers catch up with the rest of the team. Another benefit is that a clear picture of workload distribution across the team can be obtained. This is critical for ensuring workload is optimized and helps retain top analysts who are often unfairly overburdened with tasks. Some examples of the SOC metrics for analyst efficiency are:
- Outage by Analyst
- Time from Detection to Containment to Eradication by Analyst
- Percentage of Incidents Escalated to Tier-2 Analysts
Cyberbit SOC 3D: Analyst Metrics Dashboard
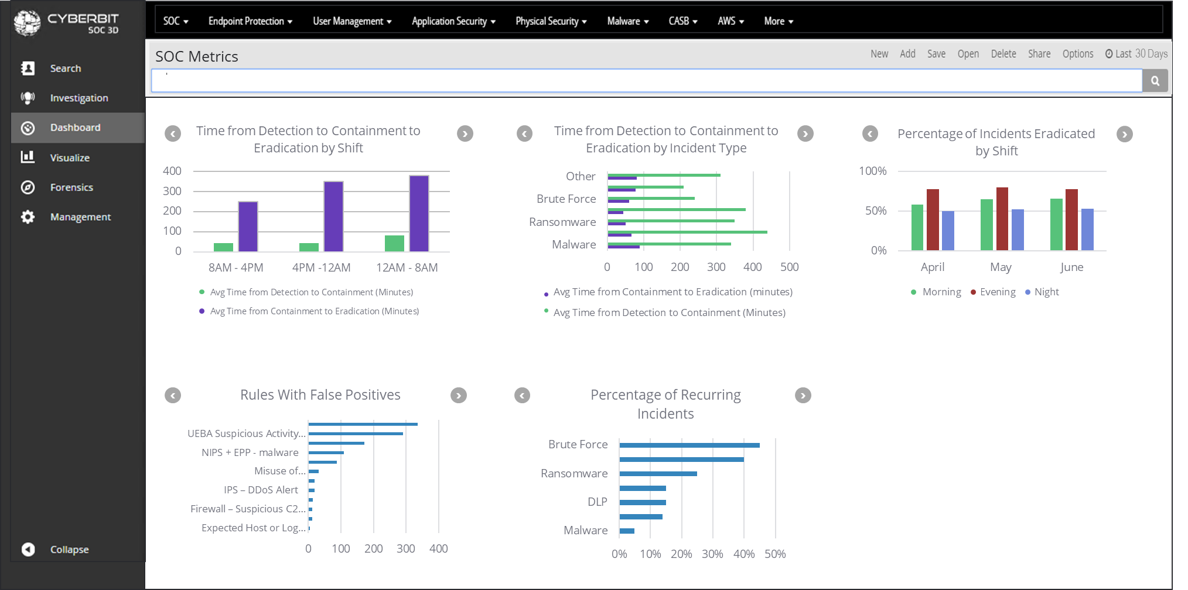
False Positive Assessment – Alert statistics assist in developing a picture of which rules are creating high volumes of false positives, so we can fine-tune them accordingly. Tuning out false positives and adjusting processes to minimize this activity can result in recaptured SOC efficiency.
Organizational Risk Identification – A common goal of a well-run SOC is to create optimized organizational cybersecurity awareness, and keep the general employee population aware of current threats. SOC 3D allows SOC managers to clearly see trends indicating which departments are responsible for a disproportionate amount of security incidents. In response, several actions become possible such as; invest in additional security awareness training for high-risk departments, increase the alert thresholds for a specific business unit, or assign a higher priority to alerts from high-risk units in the SOC.
Incident Response Bottleneck Indicators– Incident response time assessments make it easy to recognize which alerts are creating the biggest bottlenecks. Drilling down into the incident response stages for the most time-consuming alerts will provide insight into the root cause for the delay and pinpoint areas for improvement that will be most effective at reducing the bottlenecks.
Some examples of SOC efficiency are:
- Time from Detection to Containment to Eradication by Shift
- time from Detection to Containment to Eradication by Incident Type
- Percentage of Incidents Eradicated by Shift
- Rules with False Positives
- Percentage of Recurring Incidents
Cyberbit SOC 3D: SOC Metrics Dashboard
SOC Metrics for Better Transparency
While the primary function of the SOC is providing situational awareness through the detection, containment, and management of IT threats; this is coupled with the responsibility to track, report and justify the actions taken to executive management. SOC 3D metrics can assist in this oversight by providing a clear measure of the value of each new security investment. Justify budget expenditures through the demonstration of the delta between the before and after effects of new tools and training investments. It’s no longer enough to simply report on expenditures and activities. These SOC metrics can be used to demonstrate which business units are at the highest risk and the impact of SOC activity on specific departments or business processes. The board demands hard evidence that your leadership has produced value and improved the organization’s security stance. SOC3D provides the facts to back up the results.
Running the modern SOC isn’t getting any easier but at the end of the day SOC 3D automation and orchestration will make the process easier and allow for the focus to be shifted to the real challenges that will make a significant impact.
Watch FREE Webinar: Addressing the Skill Gap in the Modern SOC
About the Author
Shai Gabay is Chief Innovation Officer at Cyberbit. Prior to Cyberbit, Shai was SOC manager at Discount Bank, one of Israel’s largest commercial banks.